Seeing the Forest for the Trees
I had a comment by Alberto Cairo in mind when I selected trees in Canada as the topic for this project. He wrote in The Truthful Art, “My experience tells me that students do much better when they can work on things they care about.” And, well, I really like trees. Data is taken from Canada’s National Forest Inventory, and this project was created under the guidance of Dr. Jodie Jenkinson at the University of Toronto.


Around time when I worked on this project, I was smitten with the beautiful horizon charts created by Jorge Camoes, and went so far as plotting out my data in this chart type using lattice in R before ultimately accepting that a horizon chart wasn’t appropriate for the data I was using. Alas, horizon charts will have to be for another time.

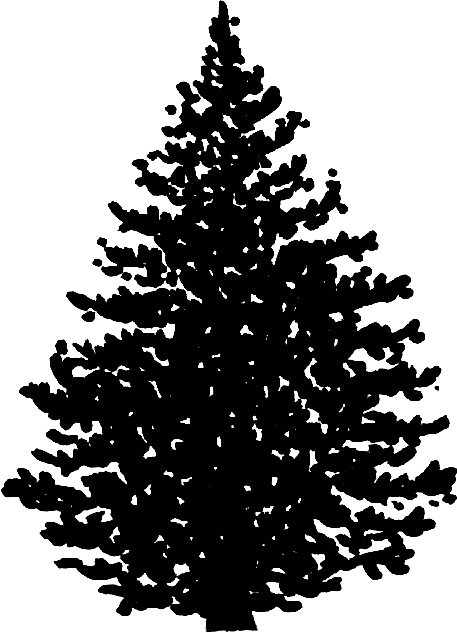
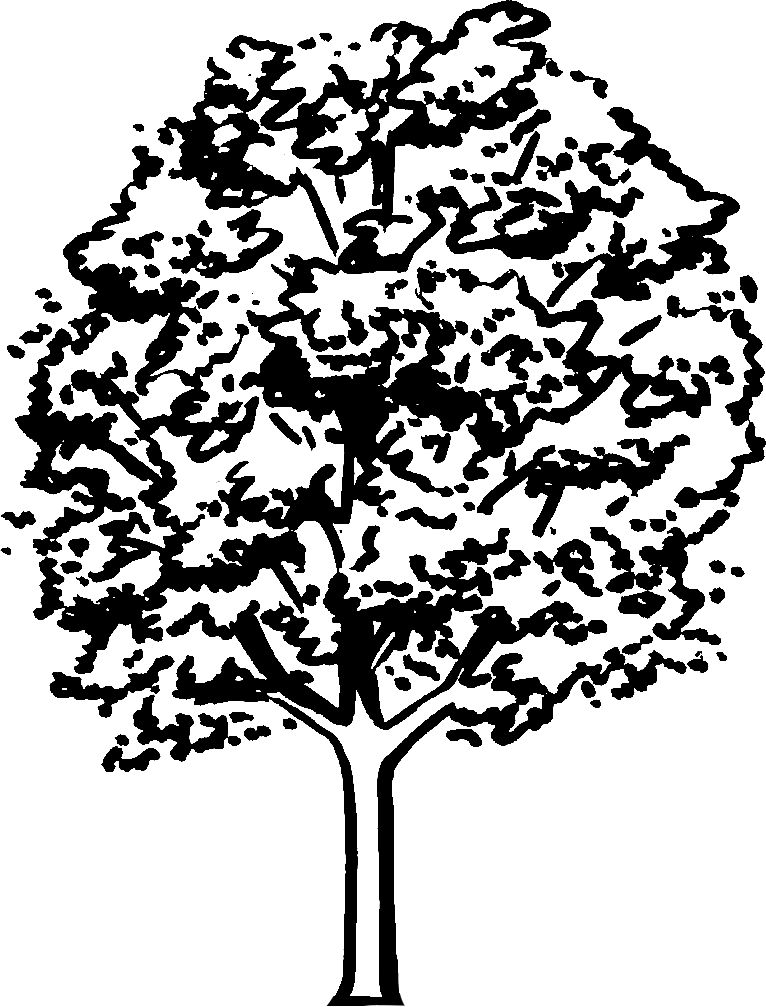
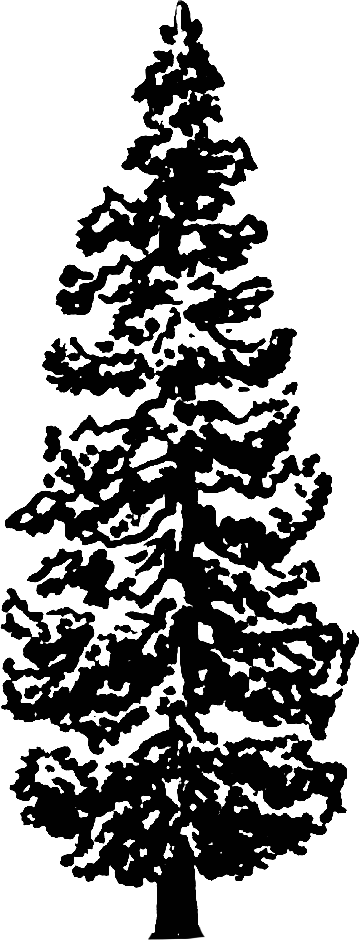
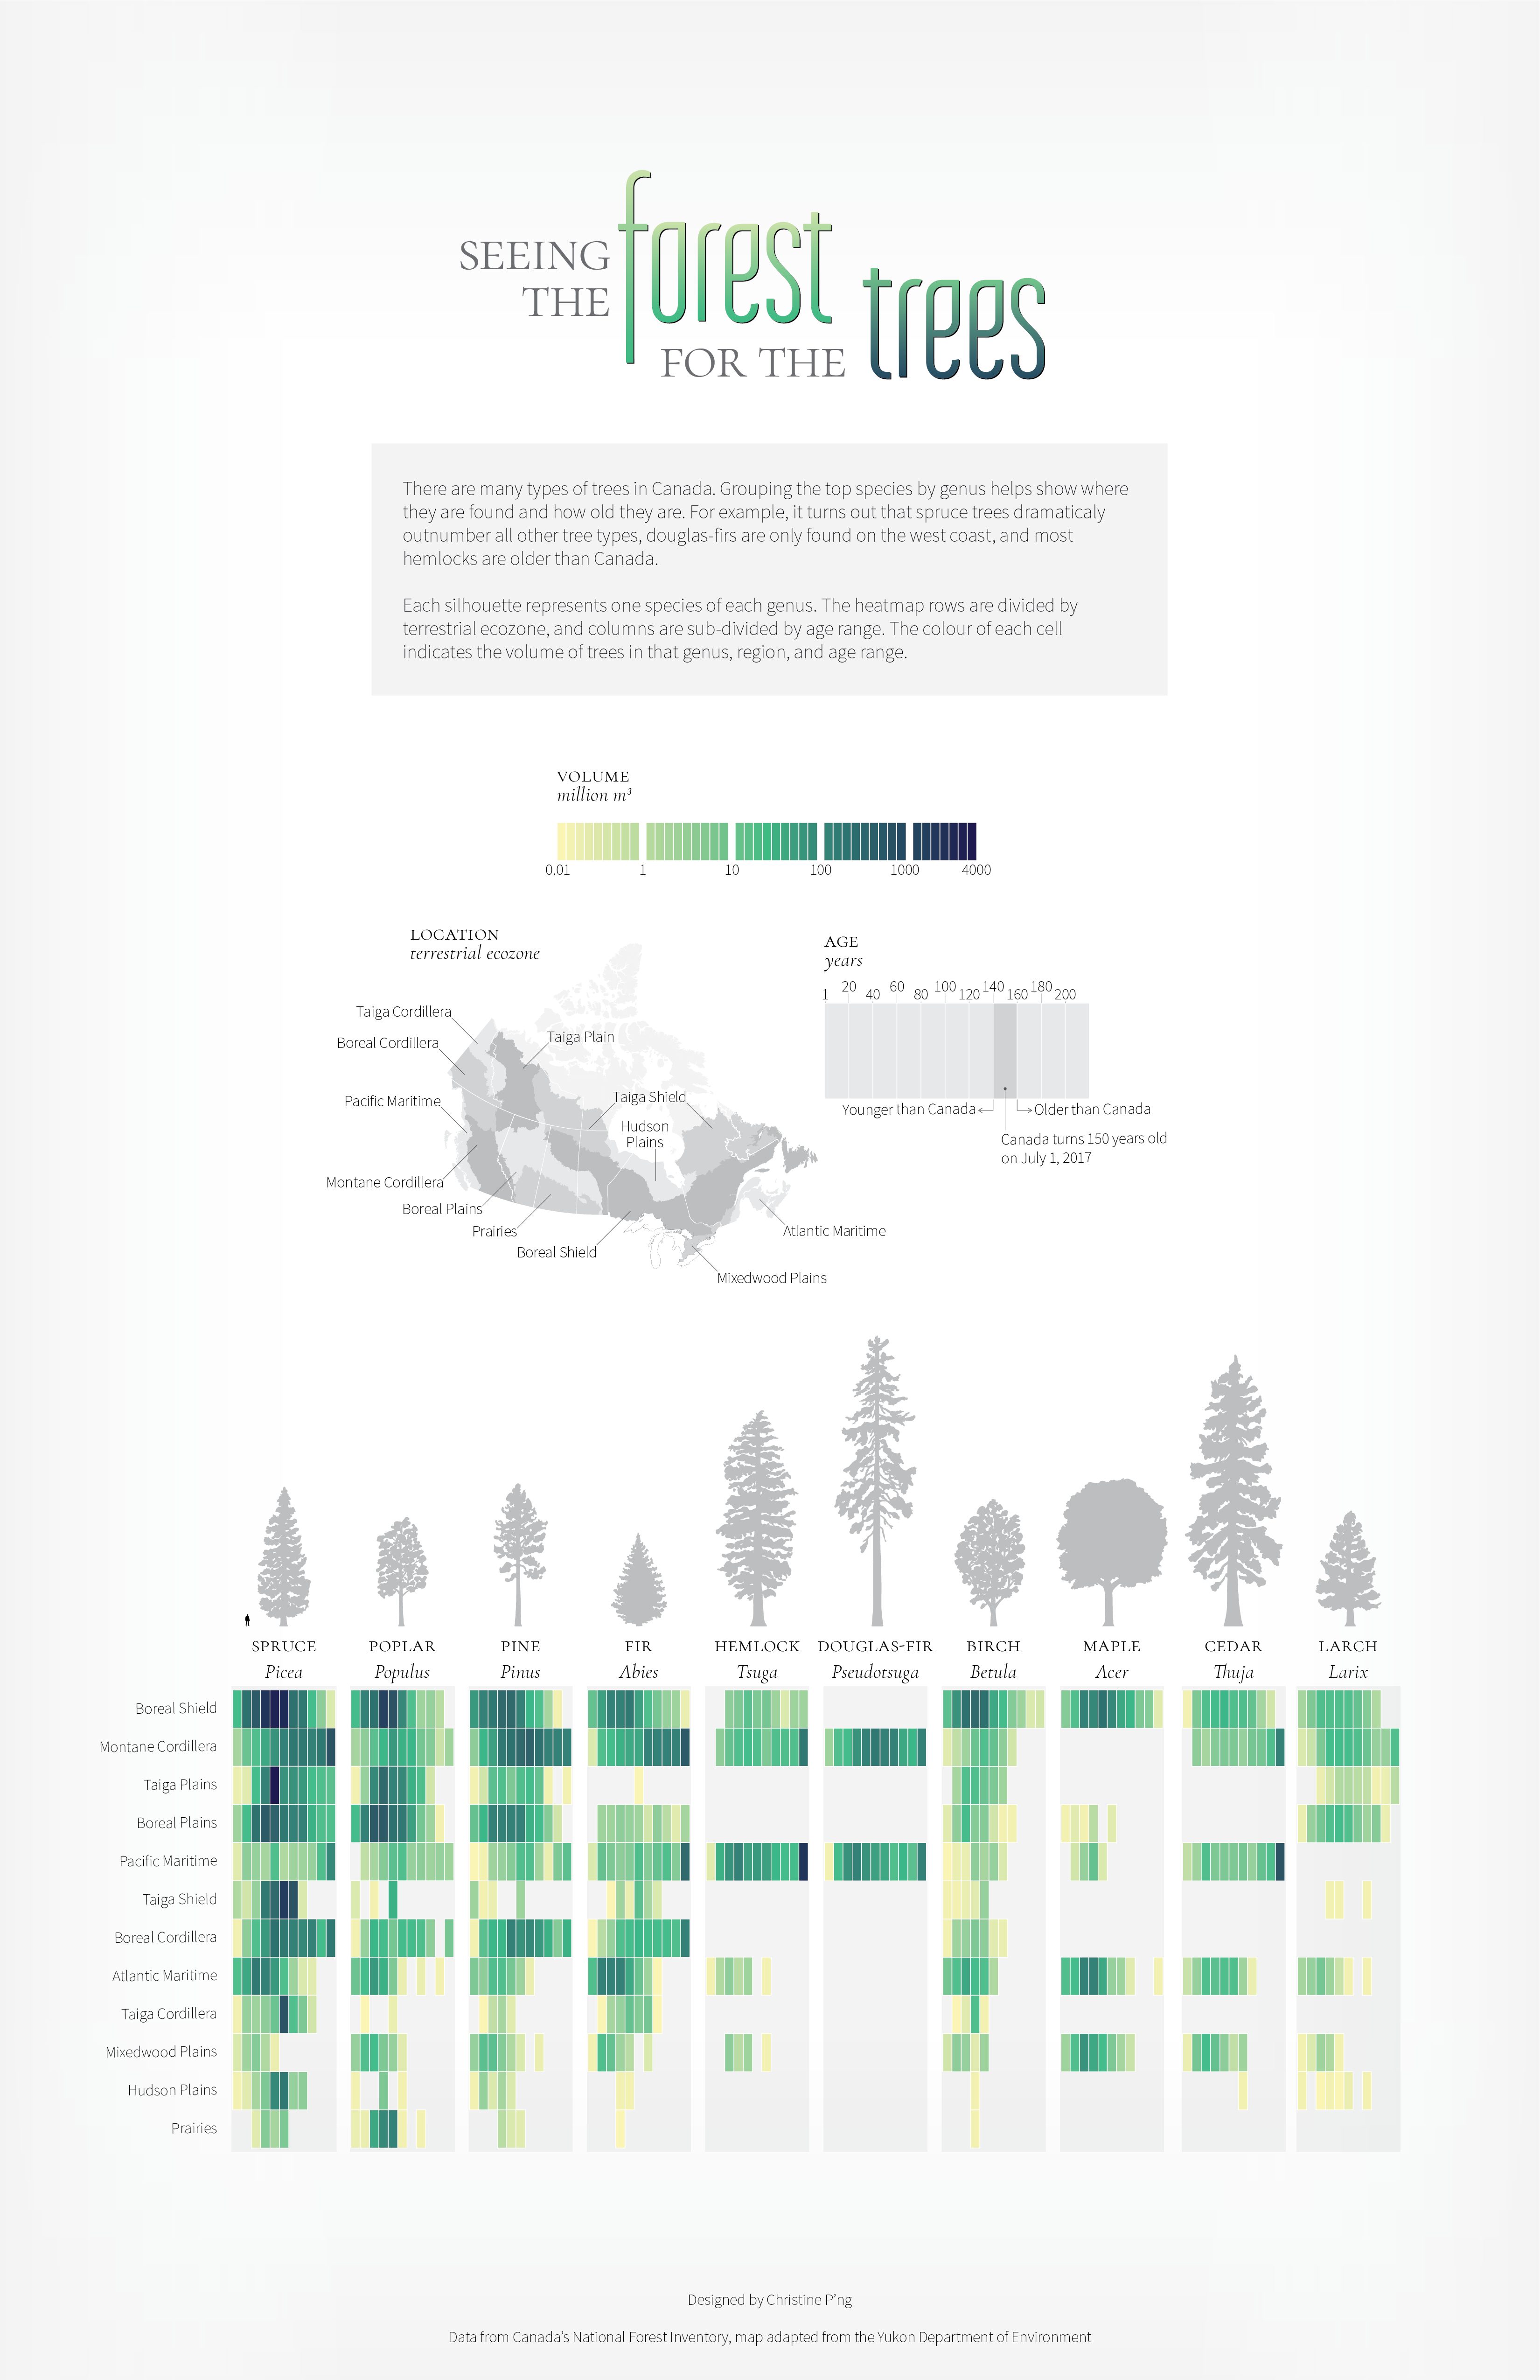
What I did end up using was a series of heat maps to encode the approximate number of trees in various regions and by species. Each silhouette represents one species of each genus. The heatmap rows are divided by terrestrial ecozone, and columns are sub-divided by age range. The colour of each cell indicates the volume of trees in that genus, region, and age range.
Working on this project taught me some cool things about trees in Canada! For example, it turns out that spruce trees dramaticaly outnumber all other tree types, douglas-firs are only found on the west coast, and most hemlocks are older than Canada.